Case Studies
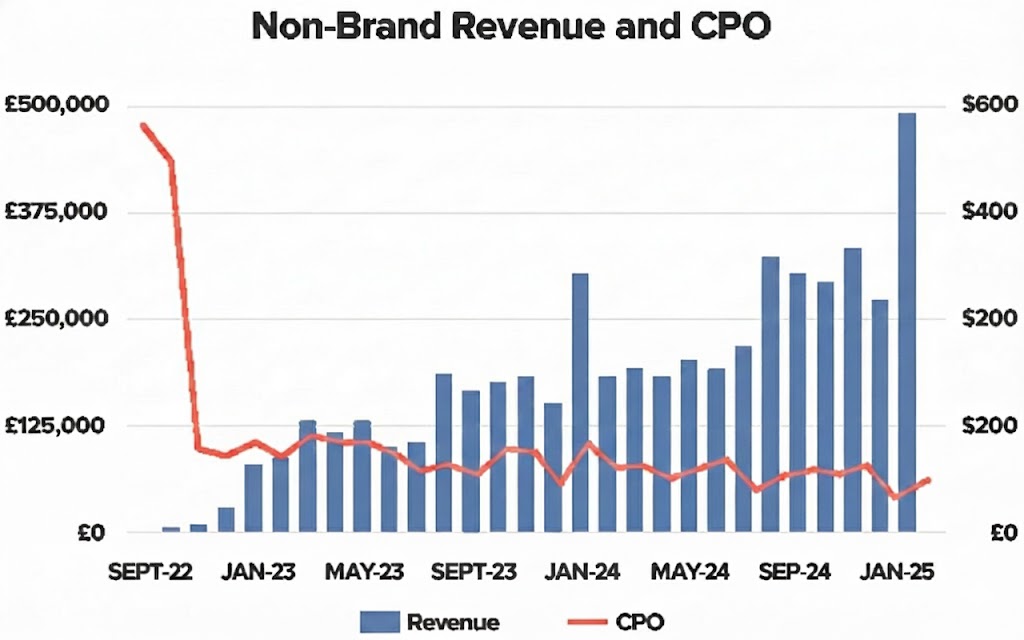
Client 1 – Ecommerce Retailer
One of my first clients, I started building out their new accounts in December 2022. In 2021 They spent an average of £5.9k on non-brand traffic per month, getting just £5.2k back in revenue per month. In 2023 I took them to an average monthly spend of £74k, with an average of £133k in monthly revenue. In 2024 I managed to increase this to an average monthly spend of £97k, with an average monthly revenue of £251k.
Key Points:
- My new campaigns launched in December 2022
- Non-brand revenue increased by 538% comparing January 2022 to January 2025
- Cost Per Order (CPO) fell by 44% comparing January 2022 to January 2025
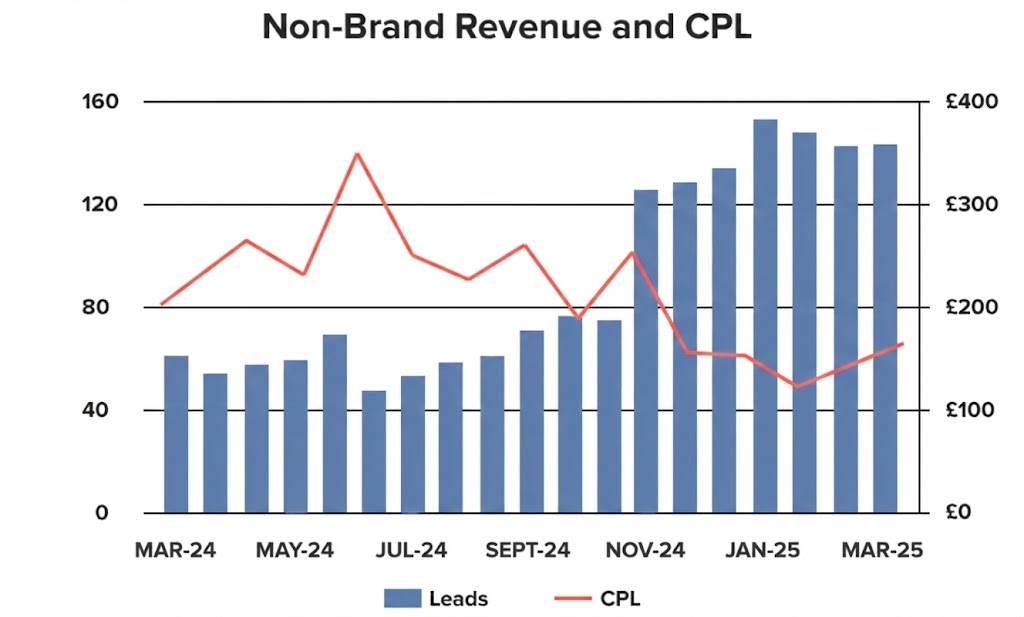
Client 2 – Financial Services
For this example I started building out the new campaigns in May 2024, with the client keen to increase leads and reduce the cost per lead. They were averaging 19 leads per month at a cost per lead of £73. Once my new campaigns went live performance started to pick up in May 2024, and then really accelerated from June onwards. The average number of monthly leads I generated for them increased to 117 between June and October 2024, with the average CPL falling to just £30. Needless to say, they were delighted.
Key Points:
- My new campaigns launched in May 2024
- Leads increased by 518% comparing April 2017 to October 2024
- Cost Per Lead (CPL) fell by 59% comparing April 2017 to October 2025
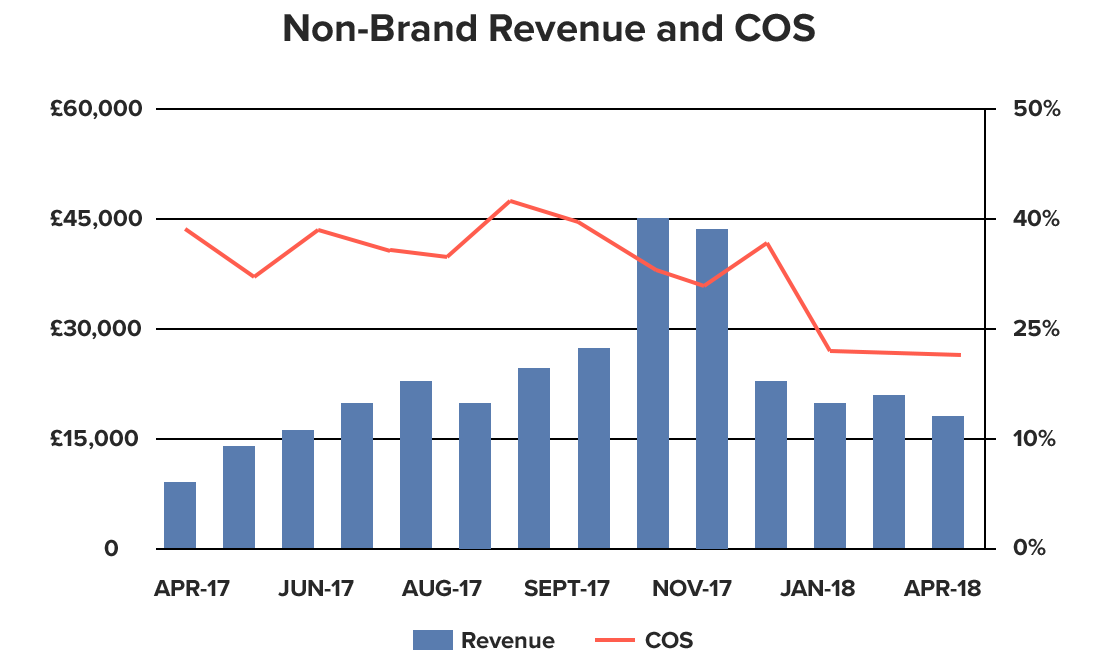
Client 3 – Ecommerce Marketplace
My new campaigns for this e-commerce marketplace went live in May 2017. Non-Brand revenue started to increase immediately and was 98% higher in April 2018 compared to April 2017. The cost of sale fell by 39% over the same period, resulting in another happy client!
Key Points:
- My new campaigns launched in May 2017
- Non-brand revenue increased by 98% comparing April 2017 to April 2018
- Cost of Sale (COS) fell by 39% comparing April 2017 to April 2018
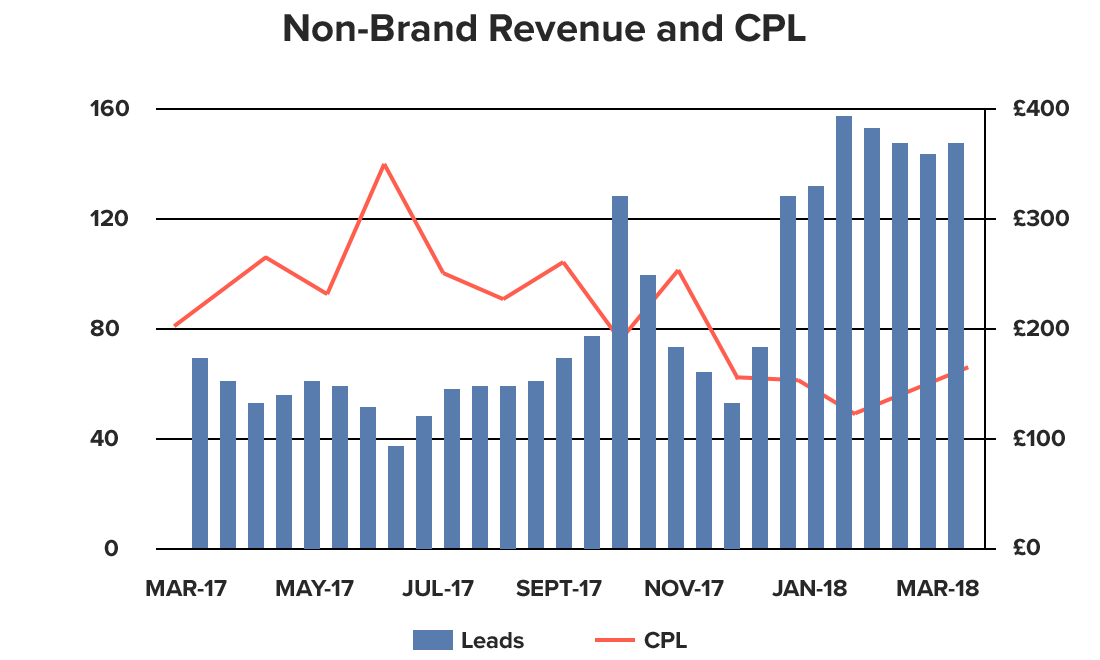
Client 4 – Ecommerce Retailer
My work for this client rolled out in October 2017 and they saw an immediate increase in leads and reduction in CPL. After the usual slow seasonal period in November and December, the new campaigns kicked in again at the start of 2018. By March 201 leads had increased 114% compared to the same month in the previous year, with the CPL falling by 30%. After such good performance I am now working with more of their brands and have almost doubled my monthly hours with them.
Key Points:
- My new campaigns launched in October 2017
- Non-brand leads increased by 114% comparing March 2017 to March 2018
- Cost Per Lead (CPL) fell by 30% comparing March 2017 to March 2018